Winning The Week 8 (Video)
· One min read


;
Read the full post here
A tag about us on a site devoted to us
View All TagsRead the full post here
This one is not quite complete.
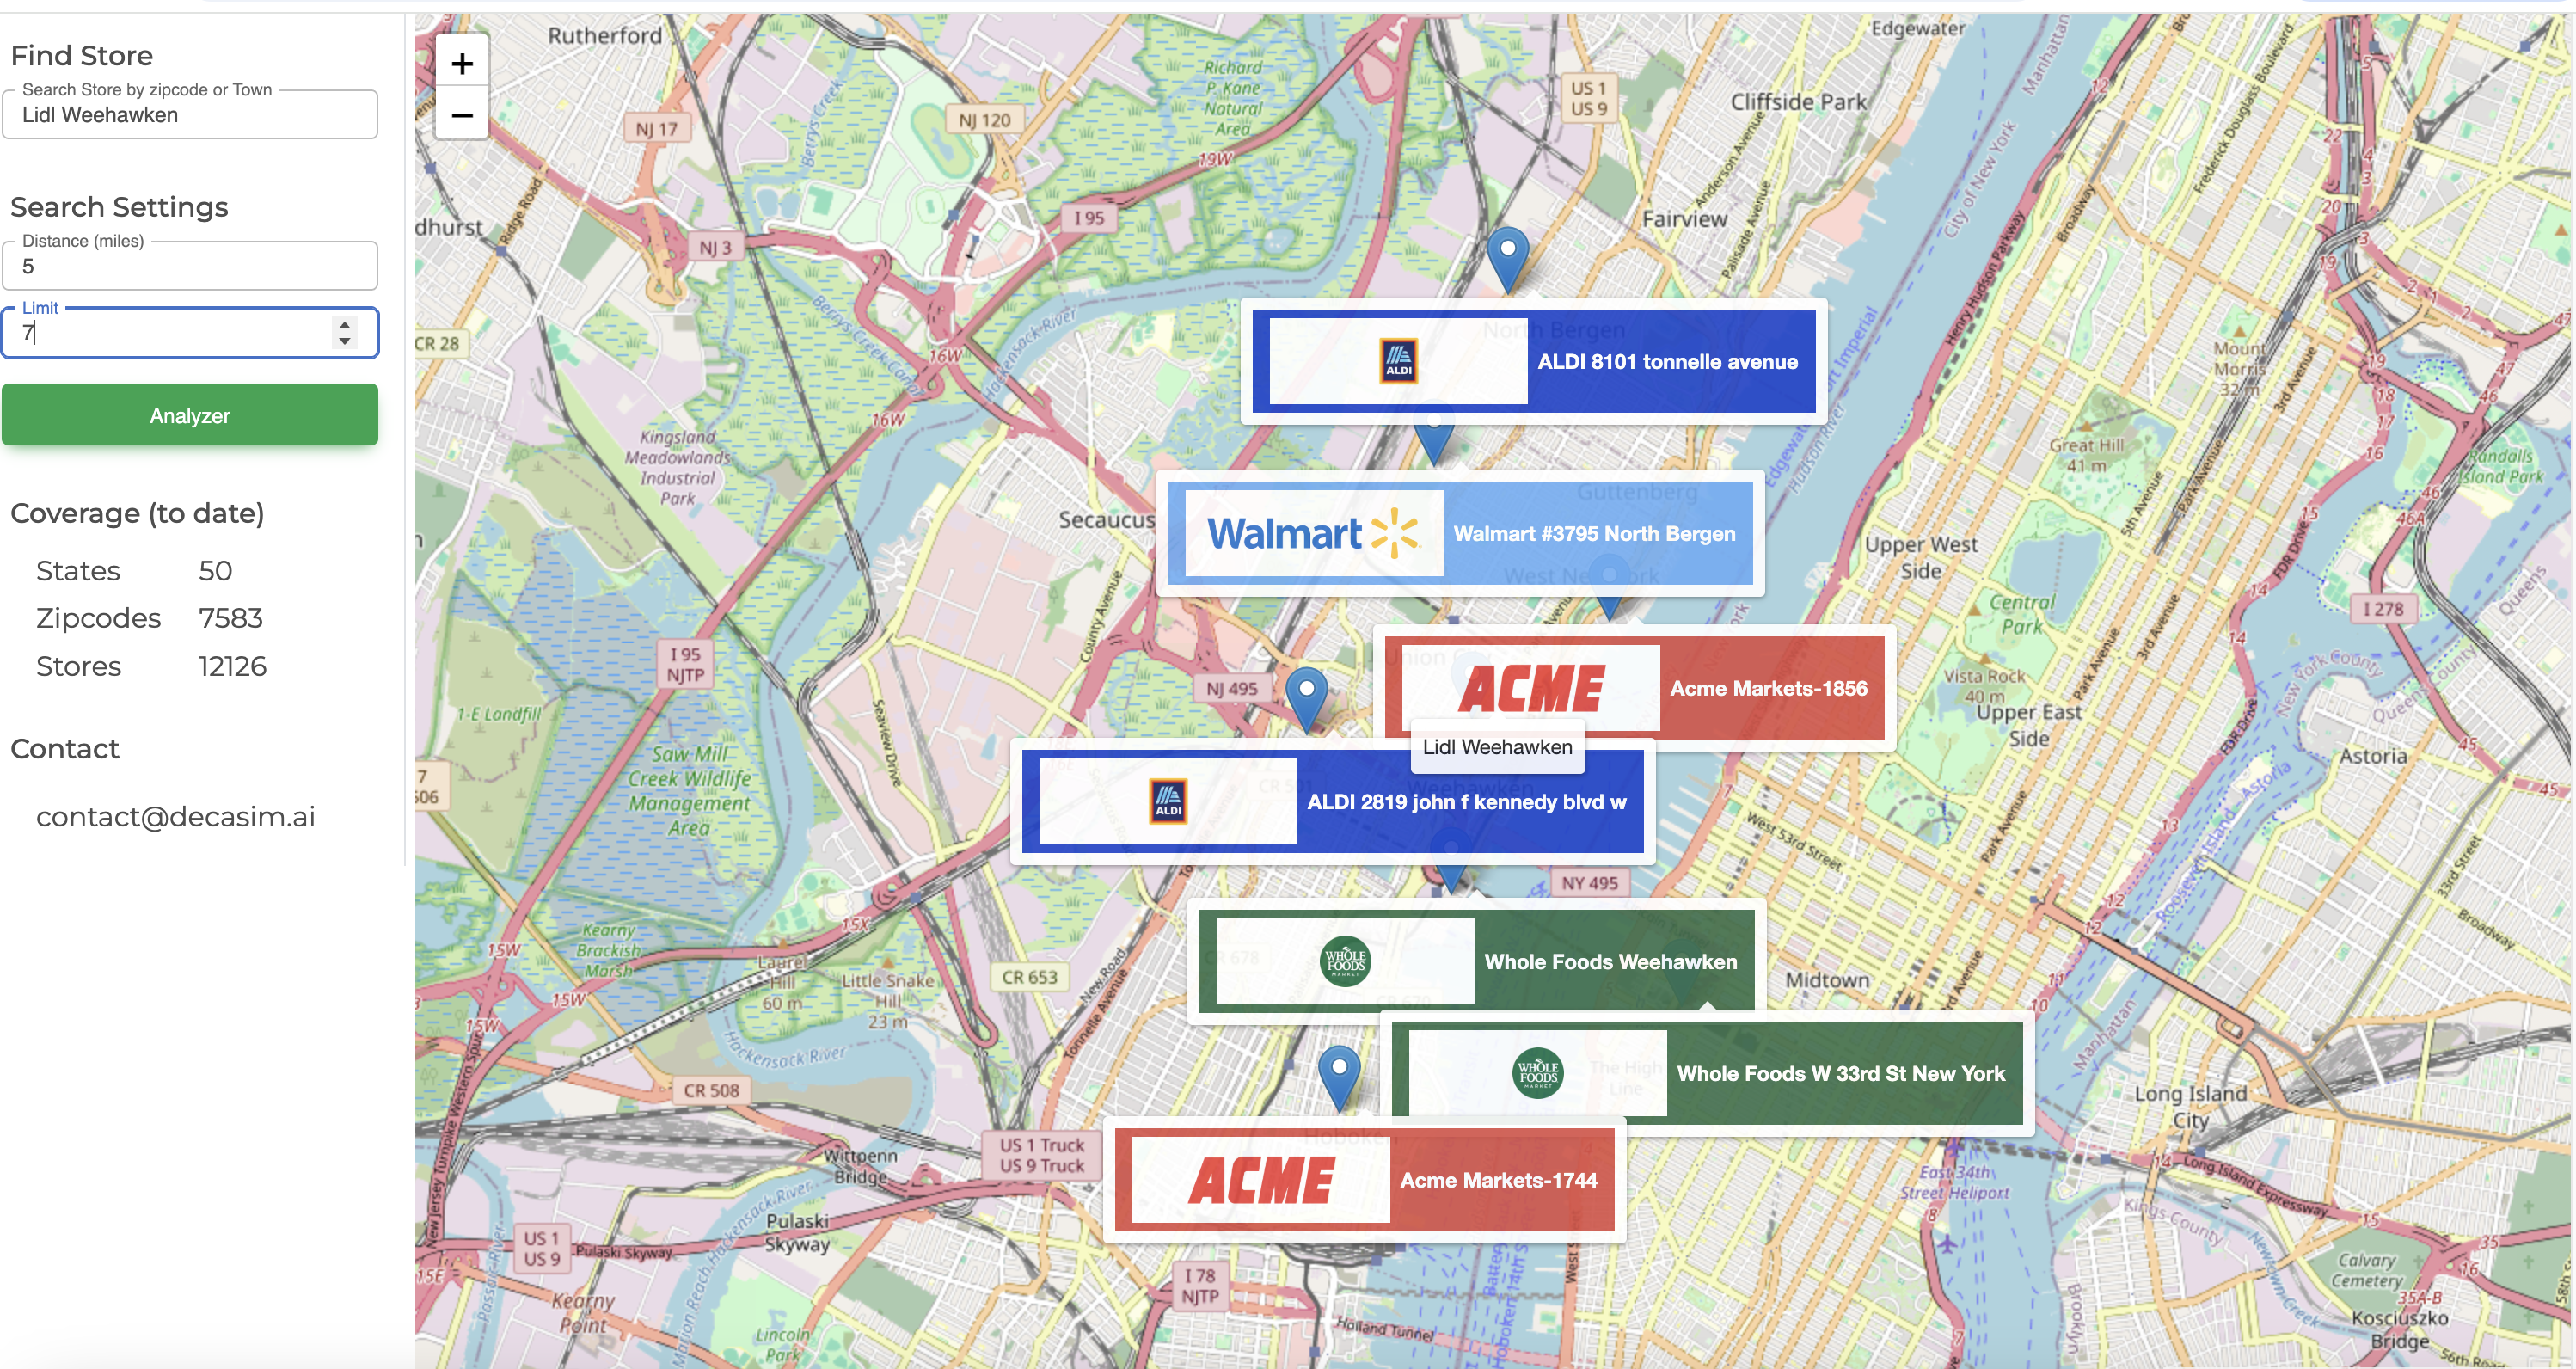
Now that we have begun to extract and process publicly available promotion data we can also create maps of price zones. Understanding where your stores overlap with your competitors' price zones is a powerful tool.
In the highly competitive U.S. grocery retail industry, valued at $883.1 billion in 2025, price promotions remain a cornerstone of retail strategy, IBISWorld, 2025[^1]. Research demonstrates that price promotions are one of the most effective tactics for supermarkets to improve performance, though their impact varies significantly across product categories and store formats, Journal of Revenue and Pricing Management[^2].
For the past month we have been revamping our Compete product. The aim of the product is to provide retailer category managers and CPG brand managers a view of the competitive landscape from the perspective of the shopper.
Reading some data from the USDA
For every 1 square-foot (SF) of restaurant space there is 0.47 SF of grocery retail space. For ever 6.3 Food Away From Home establishments there is one Food-At-Home establishment
| Segment | $Bn Sales | Establishments | Annual $mn / Estab. | Avg SF | $ / SF |
|---|---|---|---|---|---|
| Food Away From Home | $1,500 | 483,355 | $3.1 | 3K | 1000 |
| Food At Home | $1,100 | 77,021 | $14.3 | 40K | 356 |
Looking at the spend data on a per capita basis
| Segment | $Bn Sales | Popn. (mn) | Annual $ / Capita. |
|---|---|---|---|
| Food Away From Home | $1,500 | 340 | $4,411 |
| Food At Home | $1,100 | 340 | $3,235 |
Combining these stats a restaurant on average captures 100% share of wallet for Food away from home each year from ~700 people while a supermarket captures 100% of wallet from ~4400 people/year.
For an average family of 4 people, this is their breakdown of weekly spend on Food Away From Home vs Food At Home
| Segment | $ Weekly Spend |
|---|---|
| Food Away From Home | $339 |
| Food At Home | $248 |
Trader Joe's store size ranges from 10,000 SF to 15,000 SF while a Kroger Market Place stores occupy approx 145,000 SF
How do you grow a business? If you asked that question in an MBA college class, you’d get a varied set of answers, but themes would emerge: have a strategy, control costs, know your customer, a unique product/service, execute the plan. None of these answers are wrong, but MBA students’ answers miss the point: the real world is imperfect with neither the time, resources nor budgets to tackle the issue of growth from an academic standpoint. Shareholders want value…now. Customers want the product/service…now. Employees want to be taken care of…now. In established businesses, a growth strategy generally involves changing an existing course of action. What exists may be well known and preferred, and change is generally seen as something which is painful, risky and undesirable.
Which explains why many businesses eke out incremental growth year after year. So, let’s address some of the macro questions associated with growth and strategy.
According to the Harvard Business Review, they are.
So, is it true? And if so, what should we (the AI industry) and we (marketers) do about it? Luckily, HBR lives up to its reputation, offering practical advice as well as insight. And living up to our reputation for being helpful, DecaSIM decided to summarize the HBR article for you (below).
(And, yes, we used ChatGPT to create the summary. In case you’re wondering, it took about 25 seconds to write the prompt, copy the URL and copy/paste the summary into Word. It’s taken longer to write this intro.)
First of all, if you’re in the financial, distribution, restaurant/hospitality, transportation, consulting, energy or consumer industries there’s a higher-than-average chance your CEO is new. So that covers nearly all of us. In fact, those industries are responsible for 73% of all CEO turnover in the Fortune 500 and S&P 500 companies (674 in total) through August 2023.